To download this report, click here.
COVID-19 thrusted rental housing affordability into the spotlight. Headlines warned of a pending eviction tsunami. Policymakers moved to provide backstops – from direct cash stimulus to expanded unemployment pay to eviction moratoria to rental assistance. When it became clear the “tsunami” hadn’t arrived and wasn’t coming, many analysts credited those policy efforts.
But this first-of-its-kind study into one of the largest segments of the U.S. rental housing market reveals a much more significant driver keeping rental distress – and evictions – low: The vast majority of renters were able (and willing) to pay the rent. Market-rate apartment renter incomes have soared since the pandemic, keeping rent-to-income ratios much lower than widely assumed. Those ratios have inched up slightly due to the 40-year high in inflation, but not enough to meaningfully change the story on apartment affordability.
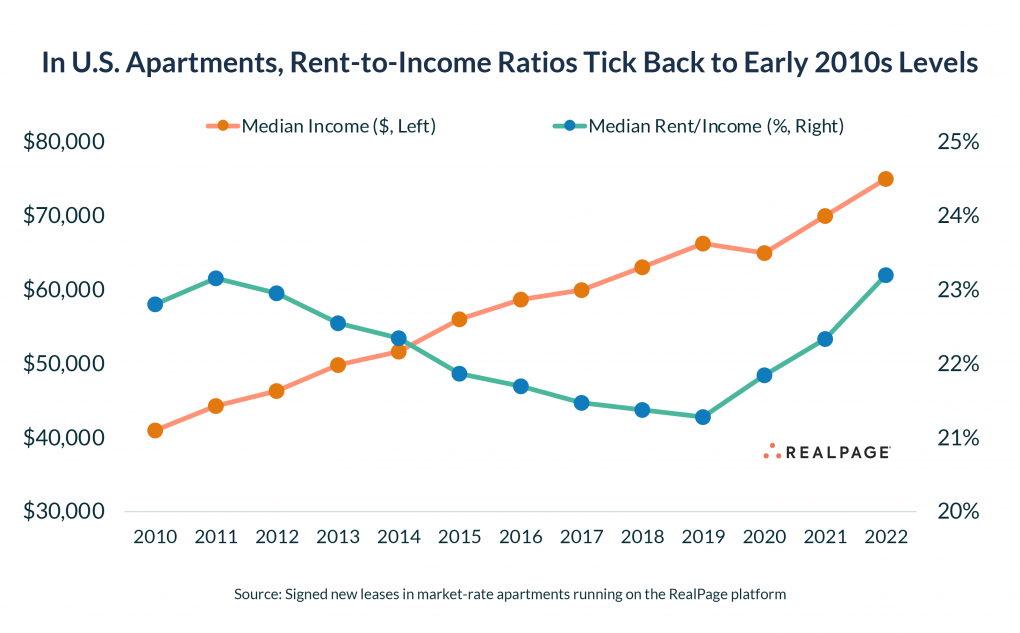
The median household income for market-rate apartment renters so far in 2022 soared to an all-time high of $75,000, up 15.4% since 2020. Over the same timeframe, the median monthly rent on a new lease jumped 21.9% to $1,510, nationally. That reversed a pattern of eight straight years of rent-to-income ratios inching downward. The share of income spent on rent ticked up from 21.3% in 2019 to 23.2% in 2022, marking a return to the 2011 norm, and still well below the generally accepted affordability ceiling of 33%.
 The income numbers – and low share of income spent on rent – are remarkable when considering the sheer volume of renters leasing apartments. The professionally managed, market-rate apartment sector has added roughly 1 million net new households since the start of 2020 through the first half 2022, even as rents have increased, pushing vacancy to record lows. Furthermore, market-rate apartment renters are consistently paying rent at near-normal levels each month. But while the depth of higher-income demand is encouraging, that does not mean every household can afford apartments. In fact, research from Harvard’s Joint Center for Housing Studies shows that demand for low-income housing is growing, too, but supply is not. And that speaks to a related but distinctly separate challenge: There’s a severe shortage of affordable housing in most parts of the country.
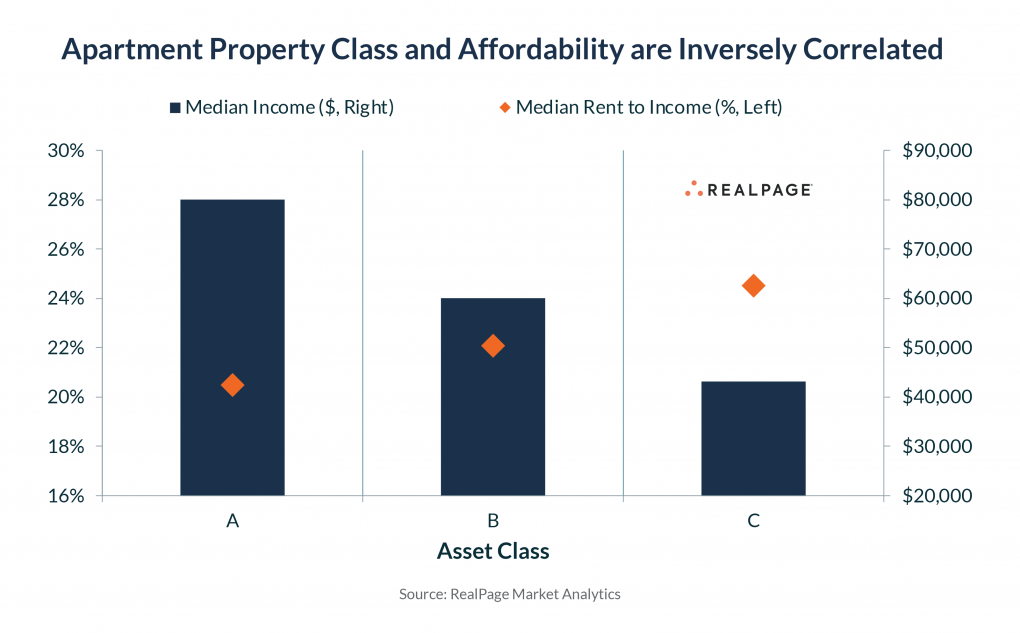
Rent-to-income ratios in market-rate apartments vary surprisingly little across the U.S., though some key patterns emerge in the data. One important trend that might appear counterintuitive: The lower the rent, the higher the rent-to-income ratio. Renters in more affordable Class C apartments have much lower incomes than renters of the pricier Class A or B, and that income gap more than offsets the rent differential. And that’s one reason Class A and B apartments are seeing larger rent increases than Class C.
How the Study Was Completed
The RealPage Market-Rate Apartment Affordability study is unique because it is the first to capture incomes and rents for the same households on a large scale, with nearly 7 million individual leases included. Past studies have mixed and matched different datasets on rents and wages. That creates a misleading view on affordability, in part because most publicly available rent data skews toward pricier, professionally managed rentals, while publicly available income data covers a much broader population.
RealPage’s study was limited to renters in market-rate, professionally managed apartments signing a new lease. The data is collected from RealPage software, where property managers record household income from lease applications along with the signed monthly rental rates. RealPage calculated the rent-to-income ratio for each lease, then took the median ratio. Income data is available only at time of initial lease signing, so RealPage is tracking incomes among renters moving into an apartment. Renewal leases were excluded because property managers rarely capture incomes at the time of renewal, and also typically offer discounted rents to a renewing resident compared to what a new resident would pay. Higher-than-normal retention rates also suggest renewal rates remain affordable. (Renewal leases are typically only offered to residents in good standing.)
It’s important to note this study should not be viewed as representative of all rental housing in America. It excludes the large “mom and pop” market of small multifamily and single-family rentals. It also excludes true affordable housing, where rent is subsidized or capped to area incomes.
But this report sheds new light on the rental affordability topic that can empower policymakers to use a more focused, scalpel approach toward rental housing affordability and accessibility. Given much higher incomes and much lower rent-to-income ratios in market-rate rentals, the real challenge is the severe shortage of true affordable housing for the millions of households who cannot afford to rent or buy. Market-rate affordability and overall rental accessibility are two different issues that are often wrongly conflated. A deep review of the data shows there’s ample demand at today’s rent levels among households spending far below 30% of income toward rent. Additionally: Vacancy remains low and rent collections high. But there’s a separate challenge that existed long before the pandemic and has only been exacerbated since then. That’s the lack of housing options for low-income households. America’s housing shortage remains most severe at the lowest price points. Simply put: Affordable housing supply has not kept pace with affordable housing demand in recent decades.
This study leveraging RealPage’s unique and vast database of residential leases reflects a deep commitment to providing facts to better inform rental housing providers and renters, both of whom RealPage serves as customers.
Rising Incomes, Steady Rent-to-Income Ratios
Between 2016 and 2019, market-rate apartment renter incomes climbed around 4.5% annually up to a high of $66,250 in 2019. Incomes among lease signers then dropped 1.9% in 2020 due to the pandemic before surging up 7.7% in 2021 and another 7.1% so far in 2022 up to a new high of $75,000.
Meanwhile, signed rents followed a similar pattern. Median signed rents (actuals, not asking rents) were increasing slightly below income growth from 2016 to 2019, so rent-to-income ratios inched back to as low as 21.3% in 2019. As housing demand and renter incomes soared, actual monthly rents jumped 11.5% in 2021 and 9.3% so far in 2022, up to $1,510. Those increases reversed the pattern of descending rent-to-income ratios. The median rent-to-income ratio in 2022 to date measured 23.2%, matching the level seen back in 2011.
RealPage’s study aligns with previously published research from Harvard’s Joint Center for Housing Studies, which showed the majority of net new renter households over the last decade had incomes above $75,000.
What makes the pandemic-era results all the more remarkable is the sheer volume of renters coming in with higher incomes. Roughly 1 million net new households entered the professionally managed, market-rate apartment sector since the start of 2020 – the biggest wave of demand in RealPage’s three decades of tracking apartments. Those numbers are even more impressive given that they occurred at the same time demand flowed heavily into for-sale homes and single-family rentals, as well.
Much of that growth in upper-income renters ties to growth in pricier apartment supply. Due to costs of development (land, construction, labor, fees, materials, etc.), the vast majority of new apartment construction has targeted higher-income renters. In fact, asking rents for an apartment unit built since 2010 averaged $2,167 per month, and for that reason, new apartments often lease to renters with six-figure incomes. Applying the current median rent-to-income ratio of 23.2% on a unit renting for $2,167 would impute an annual household income of $112,000.
While there’s been ample supply of – and demand for – more expensive rentals, there is a lack of supply creation at the lower price points. Research from Harvard and others has shown that demand for low-income housing has grown over the last decade, while supply of low-rent housing has shrunk. Due to the costs of construction, new affordable housing is unlikely to be achieved at any scale without substantially more public funding or subsidies.
Renters Aren’t Aging Nor Doubling Up More
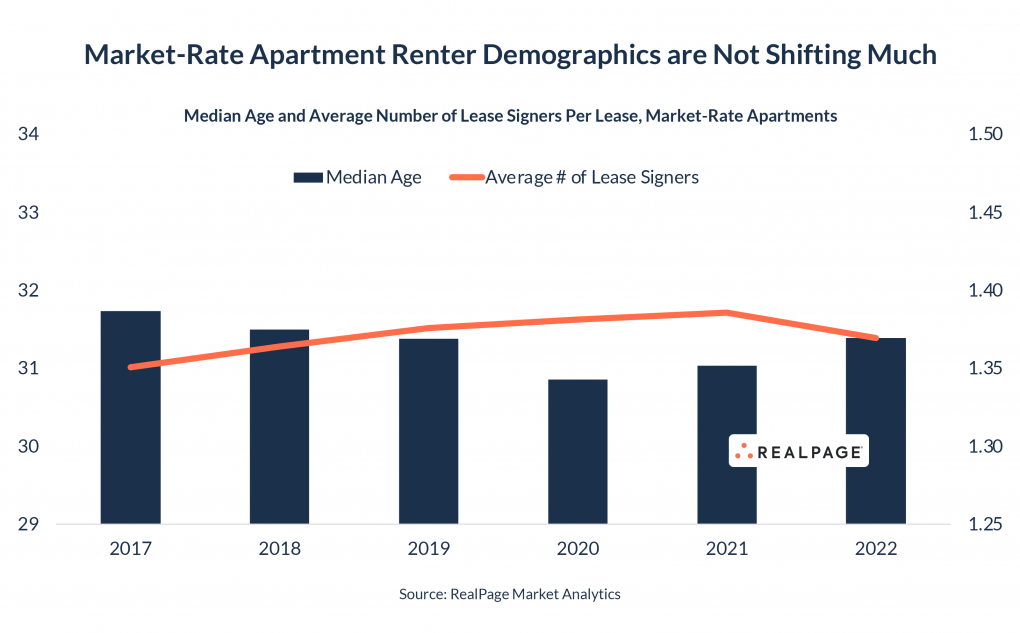
Among market-rate renters, one common theory on rising incomes has been that would-be homebuyers priced out of the for-sale market are landing in apartments, inflating the income numbers. There is no available dataset to test that theory directly, so instead, RealPage looked at the median age of apartment renters signing a lease. If that theory were true, it could be assumed that median renter ages were increasing – as renters stayed in apartments longer with the benefit of larger incomes as they advanced in their careers. But that theory did not hold up. The median adult age of apartment renters actually dropped from 31.4 in 2019 to 31.0 in 2021 before returning back to 31.4 in 2022. Median age also held consistently between 31 to 32 in the years before the pandemic.
 Another trend that could skew incomes upward would be increased reliance on roommates. Because RealPage tracks household income, apartment renter incomes reflect the combined wages of roommates. Typically, when individuals are stretched to afford housing, they are more likely to have roommates to share housing costs. The pandemic’s abrupt shift to work-from-home options for many workers provided a counterforce, as some renters chose to go solo to have more space to work from home. Those two forces appear to have largely washed out, as the average number of lease signers has inched back only slightly from 1.38 in 2019 to 1.37 in 2022.

The Pricier the Apartment, the … More Affordable?
One of the more interesting trends to emerge from the study: There’s an inverse relationship between apartment rent level and affordability. The higher the rent, the more affordable it is to those target renters. On the flip side, renters in lower-priced apartments are spending a larger share of income toward rent. So, the real gap is in income levels.
In the luxury Class A sector, the median rent-to-income ratio measured 20.5%. That compares to 22.1% in the middle-rent Class B segment and 24.5% in the lowest-price Class C properties.
And for those reasons, rents in Class C have grown slower than Class A or B – and that’s especially true upon renewal. Renewal rent increases in Class C have consistently registered below the headline Consumer Price Index (CPI), meaning a Class C renter’s housing costs are growing at a slower rate than their other expenses. As of June 2022, Class C renewal rent increases averaged 8.1%. That compares 9.1% headline inflation and renewal increases of around 11.5% in Class A and Class B apartments.
Rent-to-Income Ratios Vary Little Across the Country
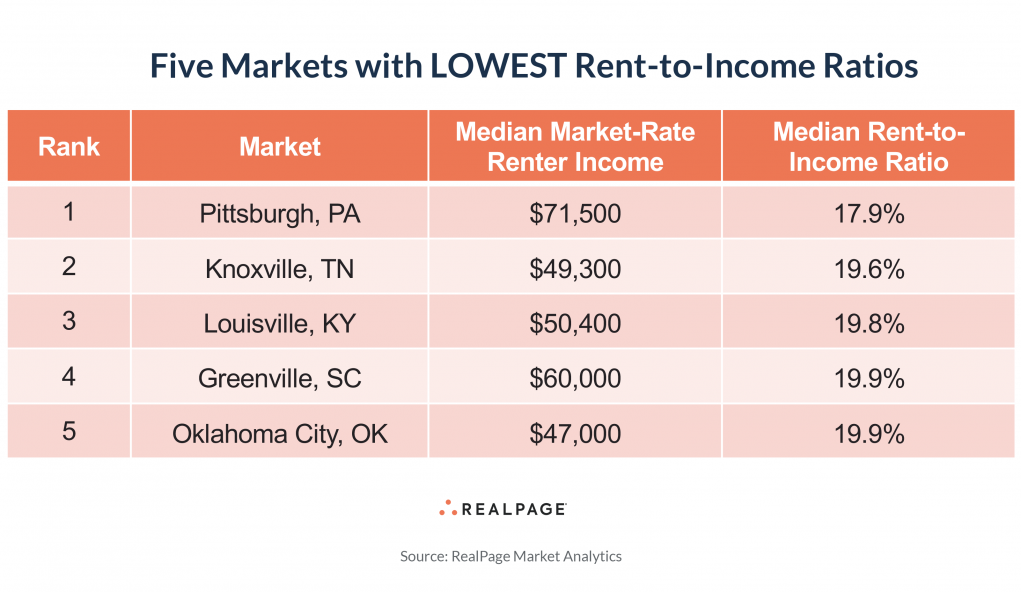
Apartment rents vary dramatically across the country, but perhaps surprisingly, rent-to-income ratios do not. Rent-to-income ratios vary from a low of 18% in Pittsburgh to 26% in Riverside. The vast majority fall within the 20% to 25% range. That’s because of a wide range of incomes across markets.
 The median income for a market-rate apartment household measured around $150,000 in San Jose, San Francisco, and New York. Incomes also reached six-figures in Los Angeles, Anaheim, Oakland, and Boston. Simply put, income levels needed to rent market-rate apartments are massively higher where rents are higher – and that’s especially true in rent-controlled markets like California and New York. As Stanford economist Rebecca Diamond, who authored a research paper on rent control’s impact, said in a Freakonomics podcast in 2019: “Because now there’s going to be less rental housing, the prices that low-income tenants are going to face when they initially want to move in are going to be higher than they would have been absent rent control.”
 On the low end of the spectrum, renter household incomes came in lowest at around $42,000 in Memphis, New Orleans, and Greensboro.
Market-Rate Renters are Paying the Rent, But Challenges Linger in Affordable
Various public surveys on rent payments have grossly underestimated rent collections due to various methodological shortcomings. RealPage examined two separate datasets: one covering market-rate apartments, and another covering designated affordable housing.
In the market-rate space, rent collections (as a percentage of billed rent) have consistently come in between 95% to 96% since the start of the pandemic in March 2020. That’s a slight deterioration from 2019, when collections averaged 96.7%. In June 2022, the most recent period available, renters paid 95.5% of rent due. Large coastal markets like New York and Los Angeles have consistently trailed the national averages, as has New Orleans. Collections have generally been higher in Sun Belt markets where rents have grown fastest.

In affordable housing (properties attached to an affordable program, such as Low Income Housing Tax Credits), rent collections tend to be lower – even pre-COVID. In 2019, affordable rent collections averaged 90.0% per month. That number fell to 88.5% in 2020 and inched down further as various stimulus programs (included expanded unemployment assistance and direct stimulus checks) wound down. Monthly rent collections averaged 87.4% in 2021, and 86.6% in the first half of 2022.
The stark differences in collections between market-rate and affordable housing show the bifurcated impact of inflation. Rising expenses (including rent increases) have so far had little impact on market-rate rent collections. But in affordable housing (where changes in rent can vary by program but generally increase much less than market rate), it’s a different story. That could suggest renters in affordable housing are struggling with other expense increases (like food and gas) and therefore have less money available to pay rent.
The split story between market-rate and affordable housing could provide policymakers with a more precise lens with which to focus additional renter aid. These statistics – combined with other reports showing an undersupply of affordable housing measuring in the millions – point to acute challenges in providing adequate affordable housing for lower-income households.
Key Conclusions
• Market-rate, professionally managed apartments have seen a massive wave of demand from mid- and upper-income renters in recent years, pushing the median renter household income to $75,000. That wave does not appear related to households unable to buy houses – who are likely ending up in single-family rentals instead.
• Renters signing leases for market-rate, professionally managed apartments in 2022 are spending 23.2% of income toward rent. That’s up from a low of 21.3% in 2019, but still well below the affordability threshold of one-third of income spent on rent.
• Higher-income renters are shouldering the largest percentage increases in rent, while lower-income renters pay a larger share of income toward rent.
• Rent-to-income ratios by metro area range from a low of 18% in Pittsburgh to 26% in Riverside. The vast majority fall within the 20% to 25% range. The results show that, as expected, pricier markets require much higher incomes.
• Market-rate renters continue to pay rent at consistent levels around 95.5%, while rent collections have gradually deteriorated among renters in affordable housing.
• Severe shortages in low-income housing, coupled with declining rent collections within that sector, point to challenges in the affordable housing market that are distinctly different from the market-rate sector. The data suggests a focused, targeted approach toward supporting affordable housing and low-income renters.
More From The Real Estate Guys…
- Sign up for The Real Estate Guys™ New Content Notifcations
- Check out all the great free info in our Special Reports library.
- Don’t miss an episode of The Real Estate Guys™ radio show. Subscribe on iTunes or Android or YouTube!
- Stay connected with The Real Estate Guys™ on Facebook, and our Feedback page.
The Real Estate Guys™ radio show and podcast provides real estate investing news, education, training, and resources to help real estate investors succeed.
Subscribe
Broadcasting since 1997 with over 600 episodes on iTunes!
Love the show? Tell the world! When you promote the show, you help us attract more great guests for your listening pleasure!


