
Both the Case-Shiller House Price Index (HPI) and the Federal Housing Finance Agency (FHFA) HPI for March were released today. Here is a graph of the month-over-month (MoM) change in the Case-Shiller National Index Seasonally Adjusted (SA).
The Case-Shiller Home Price Indices for “March” is a 3-month average of January, February and March prices.
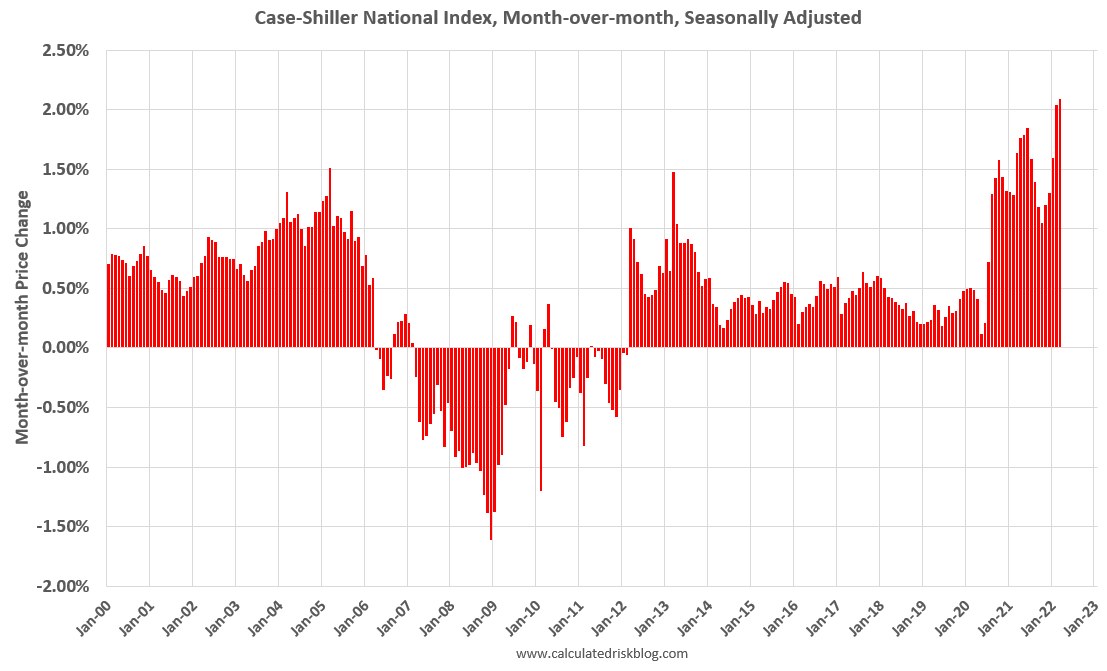
The MoM increase in Case-Shiller was at 2.09%. This is the largest MoM increase in the Case-Shiller index on record (since 1975), and stronger than any month during the housing bubble or during the late ‘70s with high inflation.
FHFA House Price Index
On the FHFA index: U.S. House Prices Rise 18.7 Percent over the Last Year; Up 4.6 Percent from the Fourth Quarter
U.S. house prices rose 18.7 percent from the first quarter of 2021 to the first quarter of 2022 according to the Federal Housing Finance Agency House Price Index (FHFA HPI®). House prices were up 4.6 percent compared to the fourth quarter of 2021. FHFA’s seasonally adjusted monthly index for March was up 1.5 percent from February.
“High appreciation rates continued across housing markets during the first quarter of 2022,” said William Doerner, Ph.D., Supervisory Economist in FHFA’s Division of Research and Statistics. “Strong demand coupled with tight supply have kept prices climbing. Through the end of March, higher mortgage rates have not yet translated into slower price gains, but new home sales have dropped during the last few months, with a significant falloff in April.”
emphasis added
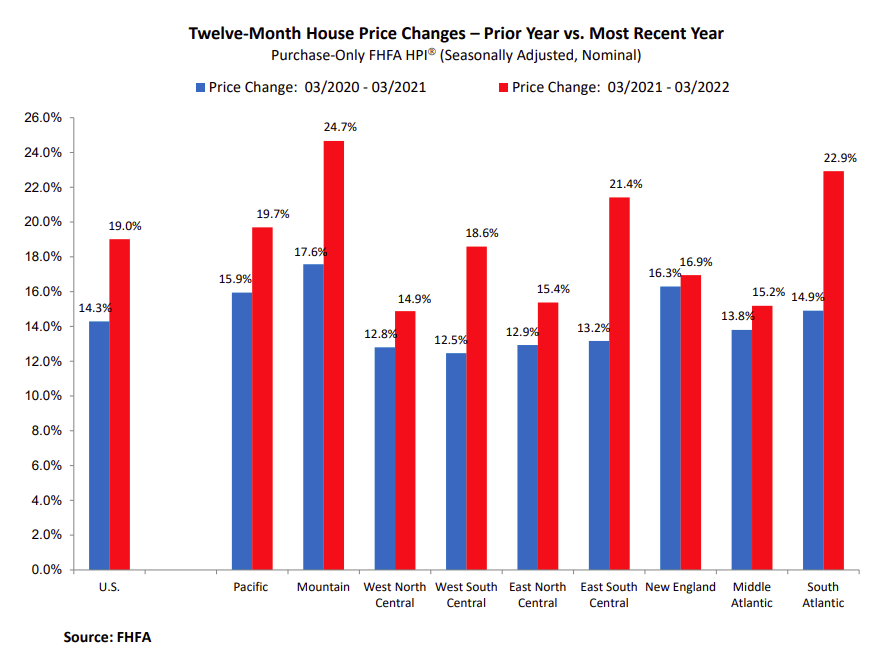
This is the monthly and quarterly indexes. Here is a graph from the FHFA report showing the annual change by region for March 2022 compared to March 2021. Prices have increased sharply everywhere, but especially in the Mountain, South Atlantic, East South Central and Pacific regions.
Case-Shiller House Prices
From S&P: S&P Corelogic Case-Shiller Index Reports Annual Home Price Gain Of 20.6% In March
he S&P CoreLogic Case-Shiller U.S. National Home Price NSA Index, covering all nine U.S. census divisions, reported a 20.6% annual gain in March, up from 20.0% in the previous month. The 10-City Composite annual increase came in at 19.5%, up from 18.7% in the previous month. The 20-City Composite posted a 21.2% year-over-year gain, up from 20.3% in the previous month.
Tampa, Phoenix, and Miami reported the highest year-over-year gains among the 20 cities in March. Tampa led the way with a 34.8% year-over-year price increase, followed by Phoenix with a 32.4% increase, and Miami with a 32.0% increase. Seventeen of the 20 cities reported higher price increases in the year ending March 2022 versus the year ending February 2022.
…
“Those of us who have been anticipating a deceleration in the growth rate of U.S. home prices will have to wait at least a month longer,” says Craig J. Lazzara, Managing Director at S&P DJI. “The National Composite Index recorded a gain of 20.6% for the 12 months ended March 2022; the 10- and 20-City Composites rose 19.5% and 21.2%, respectively. For both National and 20-City Composites, March’s reading was the highest year-over-year price change in more than 35 years of data, with the 10-City growth rate at the 99th percentile of its own history.“The strength of the Composite indices suggests very broad strength in the housing market, which we continue to observe. All 20 cities saw double-digit price increases for the 12 months ended in March, and price growth in 17 cities accelerated relative to February’s report. March’s price increase ranked in the top quintile of historical experience for every city, and in the top decile for 19 of them.
emphasis added
This graph shows the nominal seasonally adjusted Composite 10, Composite 20 and National indices (the Composite 20 was started in January 2000).
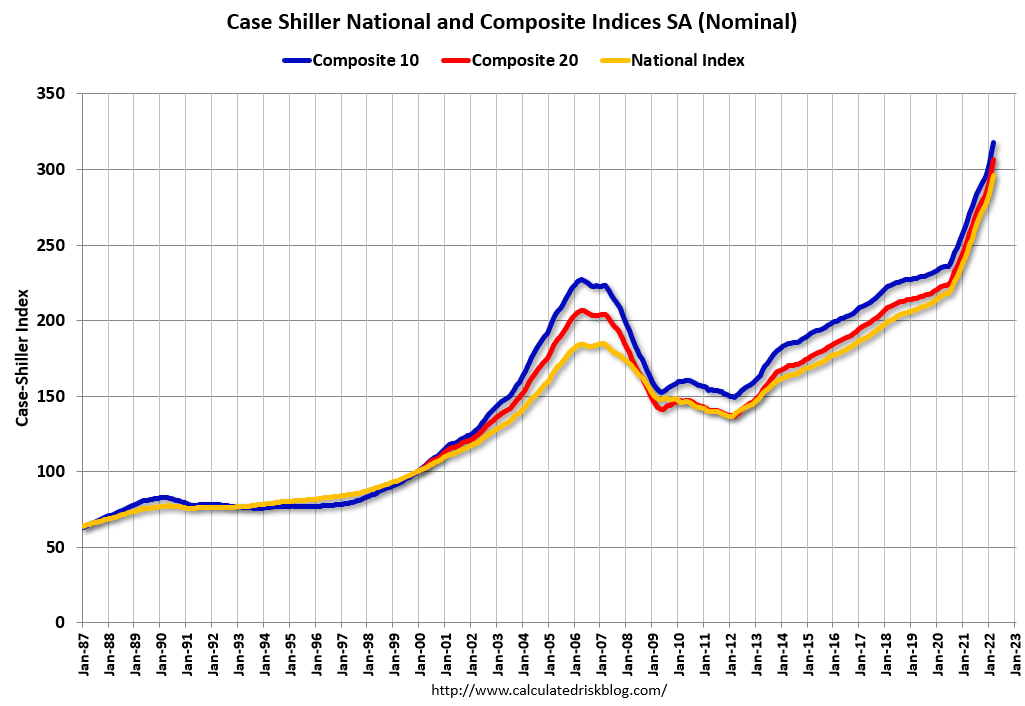
The Composite 10 index is up 2.2% in March (SA). The Composite 20 index is up 2.4% (SA) in March. The National index is 60% above the bubble peak (SA), and up 2.1% (SA) in March. The National index is up 117% from the post-bubble low set in February 2012 (SA).
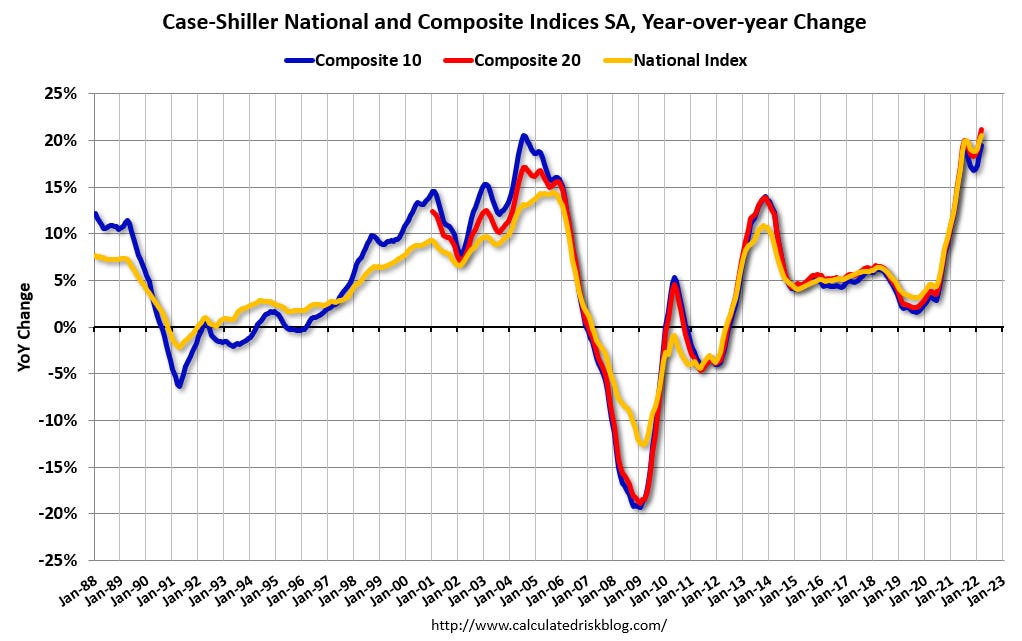
The Composite 10 SA is up 19.5% year-over-year. The Composite 20 SA is up 21.2% year-over-year. The National index SA is up 20.6% year-over-year.
House Prices and Inventory
This graph below shows existing home months-of-supply (inverted, from the NAR) vs. the seasonally adjusted month-to-month price change in the Case-Shiller National Index (both since January 1999 through March 2022).
Note that the months-of-supply is not seasonally adjusted.
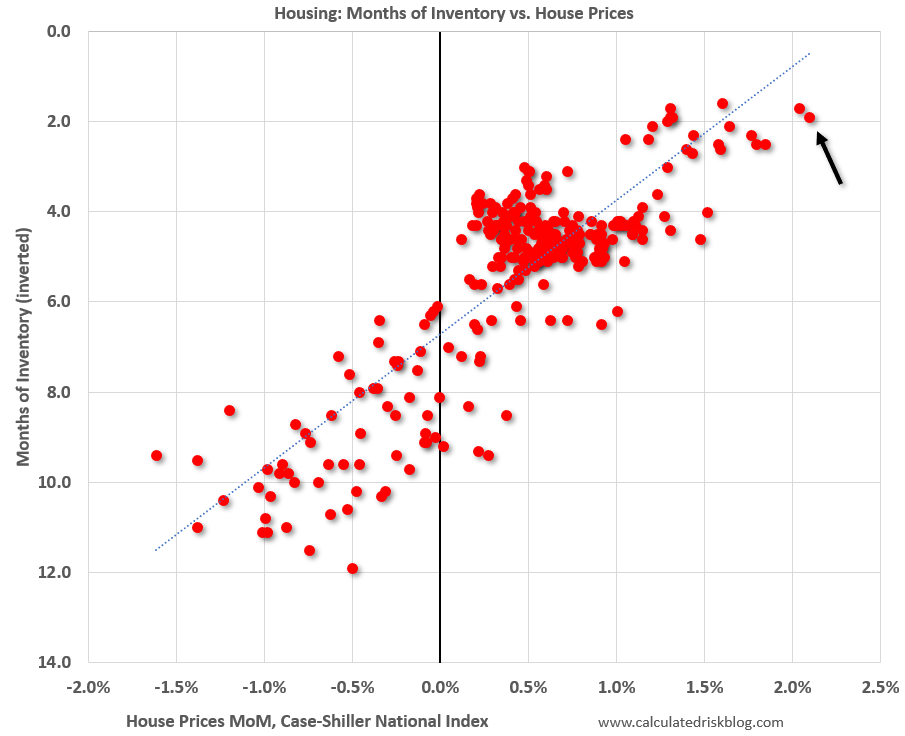
There is a clear relationship, and this is no surprise (but interesting to graph). If months-of-supply is high, prices decline. If months-of-supply is very low (like now), prices rise quickly.
In March, the months-of-supply was at 1.9 months, and the Case-Shiller National Index (SA) increased 2.09% month-over-month. The black arrow points to the March 2022 dot. In the April existing home sales report, the NAR reported months-of-supply increased to 2.2 months.
This month was very likely the peak YoY growth rate – just above the peak last August. Since inventory is now increasing year-over-year (but still low), we should expect price increases to slow.
The normal level of inventory is probably in the 4 to 6 months range, and we will have to see a significant increase in inventory to sharply slow price increases, and that is why I’m focused on inventory!
Since Case-Shiller is a 3-month average, and this report was for March (includes January and February), this included price increases when mortgage rates were significantly lower than today. In January, the Freddie Mac PMMS averaged 3.4% for a 30-year mortgage, and 3.8% in February. Currently mortgage rates are around 5.25%.
More From The Real Estate Guys…
- Check out all the great free info in our Special Reports library.
- Don’t miss an episode of The Real Estate Guys™ radio show. Subscribe on iTunes or Android or YouTube!
- Stay connected with The Real Estate Guys™ on Facebook, and our Feedback page.
The Real Estate Guys™ radio show and podcast provides real estate investing news, education, training, and resources to help real estate investors succeed.
Subscribe
Broadcasting since 1997 with over 600 episodes on iTunes!
![]()
![]()
![]()
Love the show? Tell the world! When you promote the show, you help us attract more great guests for your listening pleasure!


