
By John S Kiernan via WalletHub
Tax season can be stressful for the millions of Americans who owe money to Uncle Sam. Every year, the average U.S. household pays nearly $11,000 in federal income taxes. And while we’re all faced with that same obligation, there is significant difference when it comes to state and local taxes. Taxpayers in the most tax-expensive states, for instance, pay two times more than those in the cheapest states.
Surprisingly, though, low income taxes don’t always mean low taxes as a whole. For example, while the state of Washington’s citizens don’t pay income tax, they still end up spending over 8% of their annual income on sales and excise taxes. Texas residents also don’t pay income tax, but spend 1.74% of their income on real estate taxes, one of the highest rates in the country. Compare these to California, where residents owe almost 5% of their income in sales and excise taxes, and just 0.75% in real estate tax.
As this year’s tax-filing deadline, April 18, comes closer, it’s fair to wonder which states give their taxpayers more of a break – which is especially helpful during this period of high inflation. WalletHub searched for answers by comparing state and local tax rates in the 50 states and the District of Columbia against national medians. To illustrate, we calculated relative income-tax obligations by applying the effective income-tax rates in each state and locality to the average American’s income.
Main Findings
Taxes by State
| Overall Rank (1=Lowest) |
State | Effective Total State & Local Tax Rates on Median U.S. Household* | Annual State & Local Taxes on Median U.S. Household* | % Difference Between State & U.S. Avg.** | Annual State & Local Taxes on Median State Household*** | Adjusted Overall Rank (based on Cost of Living Index) |
|---|---|---|---|---|---|---|
| 1 | Alaska | 6.05% | $4,204 | -43.82% | $4,870 | 4 |
| 2 | Delaware | 6.34% | $4,405 | -41.14% | $4,707 | 1 |
| 3 | Montana | 7.12% | $4,948 | -33.88% | $4,773 | 2 |
| 4 | Nevada | 7.79% | $5,414 | -27.64% | $5,636 | 10 |
| 5 | Wyoming | 8.06% | $5,604 | -25.10% | $5,511 | 9 |
| 6 | Florida | 8.21% | $5,706 | -23.74% | $5,355 | 6 |
| 7 | Utah | 8.23% | $5,719 | -23.57% | $6,887 | 8 |
| 8 | Idaho | 8.29% | $5,765 | -22.96% | $5,545 | 5 |
| 9 | Colorado | 8.53% | $5,930 | -20.75% | $7,383 | 13 |
| 10 | Tennessee | 8.58% | $5,965 | -20.29% | $4,964 | 3 |
| 11 | Oregon | 8.91% | $6,192 | -17.25% | $7,329 | 22 |
| 12 | California | 8.97% | $6,238 | -16.64% | $9,612 | 32 |
| 13 | South Carolina | 9.07% | $6,304 | -15.75% | $5,288 | 11 |
| 14 | Alabama | 9.12% | $6,341 | -15.26% | $4,924 | 7 |
| 15 | District of Columbia | 9.13% | $6,343 | -15.23% | $10,357 | 46 |
| 16 | Arizona | 9.39% | $6,529 | -12.75% | $6,452 | 14 |
| 17 | West Virginia | 9.72% | $6,758 | -9.69% | $4,780 | 12 |
| 18 | New Hampshire | 9.90% | $6,879 | -8.06% | $8,061 | 31 |
| 19 | North Dakota | 10.16% | $7,064 | -5.60% | $6,652 | 25 |
| 20 | North Carolina | 10.51% | $7,307 | -2.35% | $6,302 | 16 |
| 21 | Georgia | 10.55% | $7,335 | -1.98% | $6,692 | 15 |
| 22 | New Mexico | 10.59% | $7,361 | -1.63% | $5,698 | 21 |
| 23 | Virginia | 10.69% | $7,433 | -0.66% | $8,578 | 24 |
| 24 | Hawaii | 10.70% | $7,440 | -0.57% | $10,456 | 50 |
| 25 | Louisiana | 10.75% | $7,469 | -0.18% | $5,710 | 19 |
| 26 | Massachusetts | 10.86% | $7,551 | 0.92% | $10,870 | 43 |
| 27 | South Dakota | 11.01% | $7,656 | 2.31% | $6,597 | 26 |
| 28 | Rhode Island | 11.24% | $7,816 | 4.45% | $8,842 | 44 |
| 29 | Arkansas | 11.30% | $7,852 | 4.93% | $5,712 | 18 |
| 30 | Missouri | 11.30% | $7,855 | 4.97% | $6,578 | 17 |
| 31 | Minnesota | 11.31% | $7,859 | 5.03% | $8,511 | 30 |
| 32 | Oklahoma | 11.51% | $8,002 | 6.94% | $6,154 | 23 |
| 33 | Maryland | 11.52% | $8,006 | 6.99% | $10,729 | 45 |
| 34 | Maine | 11.62% | $8,075 | 7.91% | $7,289 | 39 |
| 35 | Indiana | 11.76% | $8,173 | 9.23% | $6,851 | 28 |
| 36 | Vermont | 11.77% | $8,183 | 9.36% | $8,060 | 42 |
| 37 | Mississippi | 11.93% | $8,290 | 10.79% | $5,834 | 20 |
| 38 | Washington | 11.97% | $8,323 | 11.22% | $10,915 | 40 |
| 39 | Michigan | 12.15% | $8,449 | 12.91% | $6,965 | 27 |
| 40 | Kentucky | 12.50% | $8,687 | 16.09% | $6,698 | 29 |
| 41 | Texas | 12.73% | $8,846 | 18.21% | $8,006 | 34 |
| 42 | Wisconsin | 12.95% | $9,004 | 20.32% | $8,089 | 35 |
| 43 | New Jersey | 12.98% | $9,023 | 20.58% | $12,652 | 48 |
| 44 | Nebraska | 13.15% | $9,142 | 22.17% | $7,786 | 37 |
| 45 | Ohio | 13.20% | $9,178 | 22.66% | $7,306 | 33 |
| 46 | Iowa | 13.31% | $9,248 | 23.60% | $7,645 | 36 |
| 47 | Kansas | 13.57% | $9,433 | 26.06% | $7,919 | 38 |
| 48 | Pennsylvania | 13.92% | $9,675 | 29.30% | $8,820 | 41 |
| 49 | New York | 14.23% | $9,894 | 32.22% | $12,047 | 49 |
| 50 | Connecticut | 14.80% | $10,287 | 37.47% | $12,120 | 51 |
| 51 | Illinois | 15.05% | $10,463 | 39.83% | $9,987 | 47 |
*Assumes “Median U.S. Household” has an annual income of $69,508 (mean third quintile U.S. income); owns a home valued at $244,900 (median U.S. home value); owns a car valued at $26,220 (the highest-selling car of 2022); and spends annually an amount equal to the spending of a household earning the median U.S. income.
**National Average of State and Local Tax Rates = 10.79%
Gas Taxes (per gallon)
- 1. Alaska
- 2. Mississippi
- 3. New Mexico
- 4. Arizona
- 5. Missouri
- 47. New Jersey
- 48. Hawaii
- 49. Pennsylvania
- 50. Illinois
- 51. California
State Cigarette Tax Rates* (per pack of 20 cigarettes)
- 1. Missouri
- 2. Georgia
- 3. North Dakota
- 4. North Carolina
- T-5. Idaho
- T-5. South Carolina
- 47. Maryland
- 48. Rhode Island
- T-49. Connecticut
- T-49. New York
- 51. District of Columbia
Food Tax Rates
- T-1. Alaska
- T-1. California
- T-1. Florida
- T-1. District of Columbia
- T-1. Illinois

- 47. Missouri
- 48. Idaho
- 49. Kansas
- 50. Tennessee
- 51. Mississippi
*Note: Local Taxes are not included and can be substantial.
Blue vs. Red States
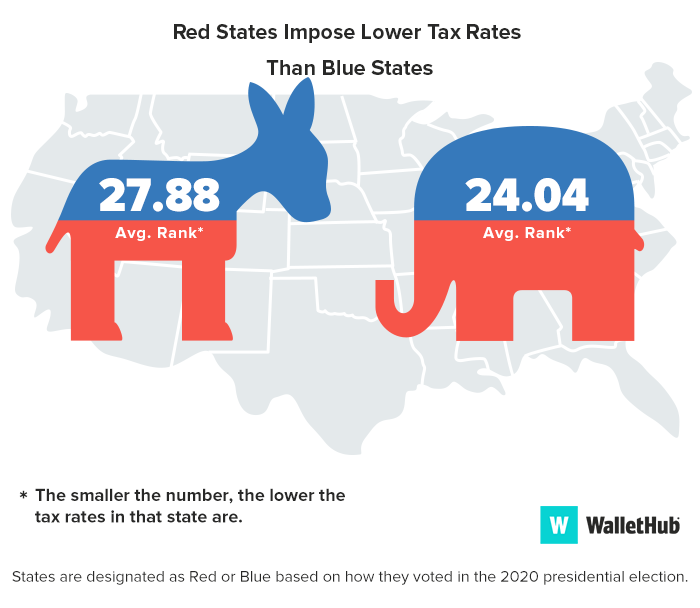
State & Local Tax Breakdown
All effective tax rates shown below were calculated as a percentage of the mean third quintile U.S. income of $69,508 and based on the characteristics of the Median U.S. Household*.
|
State |
Effective Real-Estate Tax Rate |
Real-Estate Tax Rank ($) |
Effective Vehicle Property Tax Rate |
Vehicle Property Tax Rank ($) |
Effective Income Tax Rate |
Income Tax Rank ($) |
Effective Sales & Excise Tax Rate |
Sales & Excise Tax Rank ($) |
Effective Total State & Local Tax Rates on Median U.S. Household* |
|---|---|---|---|---|---|---|---|---|---|
| Alaska | 4.32% | 34 ($3,000) |
0.00% | 1 ($0) |
0.00% | 1 ($0) |
1.73% | 5 ($1,204) |
6.05% |
| Delaware | 2.05% | 9 ($1,426) |
0.00% | 1 ($0) |
2.89% | 38 ($2,010) |
1.39% | 4 ($969) |
6.34% |
| Montana | 2.92% | 22 ($2,033) |
0.45% | 33 ($316) |
2.58% | 31 ($1,794) |
1.16% | 2 ($806) |
7.12% |
| Nevada | 1.94% | 4 ($1,346) |
0.70% | 43 ($487) |
1.00% | 11 ($697) |
4.15% | 20 ($2,885) |
7.79% |
| Wyoming | 2.14% | 11 ($1,484) |
0.68% | 41 ($472) |
0.00% | 1 ($0) |
5.25% | 39 ($3,648) |
8.06% |
| Florida | 3.04% | 24 ($2,110) |
0.00% | 1 ($0) |
0.00% | 1 ($0) |
5.17% | 38 ($3,596) |
8.21% |
| Utah | 2.04% | 8 ($1,418) |
0.00% | 1 ($0) |
2.44% | 27 ($1,695) |
3.75% | 10 ($2,606) |
8.23% |
| Idaho | 2.22% | 14 ($1,546) |
0.00% | 1 ($0) |
1.84% | 17 ($1,281) |
4.23% | 24 ($2,938) |
8.29% |
| Colorado | 1.79% | 3 ($1,243) |
0.67% | 40 ($468) |
1.92% | 18 ($1,333) |
4.15% | 21 ($2,886) |
8.53% |
| Tennessee | 2.31% | 15 ($1,606) |
0.00% | 1 ($0) |
0.10% | 7 ($70) |
6.17% | 45 ($4,289) |
8.58% |
| Oregon | 3.26% | 27 ($2,266) |
0.00% | 1 ($0) |
4.55% | 50 ($3,162) |
1.10% | 1 ($763) |
8.91% |
| California | 2.63% | 16 ($1,828) |
0.25% | 28 ($170) |
1.36% | 13 ($947) |
4.74% | 33 ($3,292) |
8.97% |
| South Carolina | 1.98% | 5 ($1,379) |
0.99% | 48 ($690) |
2.29% | 23 ($1,593) |
3.80% | 13 ($2,641) |
9.07% |
| Alabama | 1.45% | 2 ($1,007) |
0.26% | 29 ($181) |
2.49% | 30 ($1,730) |
4.93% | 36 ($3,424) |
9.12% |
| District of Columbia | 2.02% | 7 ($1,402) |
0.00% | 1 ($0) |
2.45% | 28 ($1,701) |
4.66% | 31 ($3,240) |
9.13% |
| Arizona | 2.19% | 13 ($1,520) |
0.63% | 39 ($440) |
1.46% | 14 ($1,017) |
5.11% | 37 ($3,551) |
9.39% |
| West Virginia | 2.07% | 10 ($1,437) |
0.63% | 38 ($440) |
3.04% | 43 ($2,113) |
3.98% | 16 ($2,768) |
9.72% |
| New Hampshire | 7.37% | 48 ($5,120) |
0.68% | 41 ($472) |
0.50% | 8 ($349) |
1.35% | 3 ($939) |
9.90% |
| North Dakota | 3.51% | 30 ($2,441) |
0.00% | 1 ($0) |
0.59% | 9 ($411) |
6.06% | 43 ($4,212) |
10.16% |
| North Carolina | 2.82% | 19 ($1,963) |
0.45% | 32 ($314) |
2.87% | 36 ($1,998) |
4.36% | 27 ($3,032) |
10.51% |
| Georgia | 3.15% | 25 ($2,192) |
0.00% | 1 ($0) |
3.00% | 42 ($2,088) |
4.39% | 28 ($3,054) |
10.55% |
| New Mexico | 2.80% | 18 ($1,948) |
0.00% | 1 ($0) |
1.56% | 15 ($1,082) |
6.23% | 46 ($4,331) |
10.59% |
| Virginia | 2.89% | 20 ($2,006) |
1.49% | 51 ($1,039) |
2.77% | 34 ($1,928) |
3.54% | 8 ($2,461) |
10.69% |
| Hawaii | 1.01% | 1 ($700) |
0.00% | 1 ($0) |
3.74% | 47 ($2,598) |
5.96% | 42 ($4,142) |
10.70% |
| Louisiana | 1.99% | 6 ($1,384) |
0.04% | 26 ($26) |
2.10% | 20 ($1,463) |
6.61% | 49 ($4,597) |
10.75% |
| Massachusetts | 4.22% | 33 ($2,936) |
0.85% | 46 ($590) |
2.83% | 35 ($1,970) |
2.96% | 6 ($2,056) |
10.86% |
| South Dakota | 4.37% | 35 ($3,040) |
0.00% | 1 ($0) |
0.00% | 1 ($0) |
6.64% | 50 ($4,616) |
11.01% |
| Rhode Island | 5.40% | 41 ($3,752) |
0.00% | 1 ($0) |
1.83% | 16 ($1,271) |
4.02% | 17 ($2,793) |
11.24% |
| Arkansas | 2.18% | 12 ($1,513) |
0.38% | 31 ($267) |
2.44% | 26 ($1,694) |
6.30% | 47 ($4,378) |
11.30% |
| Missouri | 3.44% | 29 ($2,389) |
0.99% | 49 ($690) |
2.71% | 32 ($1,883) |
4.16% | 22 ($2,893) |
11.30% |
| Minnesota | 3.90% | 32 ($2,708) |
0.48% | 34 ($337) |
2.75% | 33 ($1,913) |
4.17% | 23 ($2,901) |
11.31% |
| Oklahoma | 3.16% | 26 ($2,194) |
0.00% | 1 ($0) |
2.28% | 22 ($1,588) |
6.07% | 44 ($4,220) |
11.51% |
| Maryland | 3.78% | 31 ($2,628) |
0.00% | 1 ($0) |
4.05% | 48 ($2,812) |
3.69% | 9 ($2,566) |
11.52% |
| Maine | 4.52% | 36 ($3,143) |
0.91% | 47 ($629) |
2.13% | 21 ($1,483) |
4.06% | 18 ($2,820) |
11.62% |
| Indiana | 2.91% | 21 ($2,021) |
0.50% | 35 ($350) |
3.56% | 46 ($2,476) |
4.78% | 34 ($3,326) |
11.76% |
| Vermont | 6.69% | 47 ($4,652) |
0.00% | 1 ($0) |
1.32% | 12 ($916) |
3.76% | 12 ($2,616) |
11.77% |
| Mississippi | 2.79% | 17 ($1,937) |
1.32% | 50 ($917) |
2.47% | 29 ($1,719) |
5.35% | 40 ($3,717) |
11.93% |
| Washington | 3.32% | 28 ($2,311) |
0.00% | 1 ($0) |
0.00% | 1 ($0) |
8.65% | 51 ($6,012) |
11.97% |
| Michigan | 5.22% | 38 ($3,630) |
0.23% | 27 ($160) |
2.95% | 40 ($2,050) |
3.75% | 11 ($2,608) |
12.15% |
| Kentucky | 3.00% | 23 ($2,084) |
0.55% | 36 ($379) |
5.01% | 51 ($3,483) |
3.94% | 15 ($2,740) |
12.50% |
| Texas | 6.12% | 46 ($4,255) |
0.00% | 1 ($0) |
0.00% | 1 ($0) |
6.60% | 48 ($4,591) |
12.73% |
| Wisconsin | 6.10% | 45 ($4,243) |
0.00% | 1 ($0) |
2.96% | 41 ($2,061) |
3.88% | 14 ($2,700) |
12.95% |
| New Jersey | 8.71% | 51 ($6,057) |
0.00% | 1 ($0) |
0.78% | 10 ($545) |
3.48% | 7 ($2,421) |
12.98% |
| Nebraska | 5.90% | 43 ($4,102) |
0.55% | 37 ($384) |
2.08% | 19 ($1,446) |
4.62% | 30 ($3,209) |
13.15% |
| Ohio | 5.39% | 39 ($3,748) |
0.00% | 1 ($0) |
3.14% | 44 ($2,181) |
4.67% | 32 ($3,249) |
13.20% |
| Iowa | 5.53% | 42 ($3,843) |
0.38% | 30 ($262) |
2.89% | 37 ($2,010) |
4.51% | 29 ($3,133) |
13.31% |
| Kansas | 5.03% | 37 ($3,500) |
0.72% | 44 ($500) |
2.33% | 25 ($1,617) |
5.49% | 41 ($3,817) |
13.57% |
| Pennsylvania | 5.40% | 40 ($3,751) |
0.00% | 1 ($0) |
4.21% | 49 ($2,928) |
4.31% | 26 ($2,996) |
13.92% |
| New York | 6.09% | 44 ($4,231) |
0.00% | 1 ($0) |
3.33% | 45 ($2,317) |
4.81% | 35 ($3,347) |
14.23% |
| Connecticut | 7.56% | 49 ($5,256) |
0.80% | 45 ($555) |
2.30% | 24 ($1,595) |
4.14% | 19 ($2,880) |
14.80% |
| Illinois | 7.86% | 50 ($5,465) |
0.00% | 1 ($0) |
2.90% | 39 ($2,016) |
4.29% | 25 ($2,982) |
15.05% |
Methodology
In order to identify the states with the highest and lowest tax rates, WalletHub compared the 50 states and the District of Columbia across four types of taxation:
- Real-Estate Tax: We first divided the “Median Real-Estate Tax Amount Paid” by the “Median Home Price” in each state. We then applied the resulting rates to a house worth $244,900, the median value for a home in the U.S., in order to obtain the dollar amount paid as real-estate tax per household.
- Vehicle Property Tax: We examined data for cities and counties collectively accounting for at least 50 percent of the state’s population and extrapolated this to the state level using weighted averages based on population size. For each state, we assumed all residents own the same car: a Toyota Camry LE four-door sedan, 2022’s highest-selling car, valued at $26,220, as of February 2023.
- Income Tax: We used the percentage of income (middle income rate) spent on income tax from WalletHub’s Best States to Be Rich or Poor from a Tax Perspective report. “Income” refers to the mean third quintile U.S. income amount of $69,508.
- Sales & Excise Tax: We used the percentage of income (middle income rate) spent on sales and excise taxes from WalletHub’s Best States to Be Rich or Poor from a Tax Perspective report. “Income” refers to the mean third quintile U.S. income amount of $69,508.
Sources: Data used to create this ranking were collected from the U.S. Census Bureau, Bureau of Labor Statistics, Tax Foundation, Federation of Tax Administrators, American Petroleum Institute, Campaign for Tobacco-Free Kids, National Automobile Dealers Association, each state’s Department of Motor Vehicles and WalletHub research.
More From The Real Estate Guys…
- Sign up for The Real Estate Guys™ New Content Notifcations
- Check out all the great free info in our Special Reports library.
- Don’t miss an episode of The Real Estate Guys™ radio show. Subscribe on iTunes or Android or YouTube!
- Stay connected with The Real Estate Guys™ on Facebook, and our Feedback page.
The Real Estate Guys™ radio show and podcast provides real estate investing news, education, training, and resources to help real estate investors succeed.
Subscribe
Broadcasting since 1997 with over 600 episodes on iTunes!
![]()
![]()
![]()
Love the show? Tell the world! When you promote the show, you help us attract more great guests for your listening pleasure!


