
By Dhaval Joshi, of BCA Research
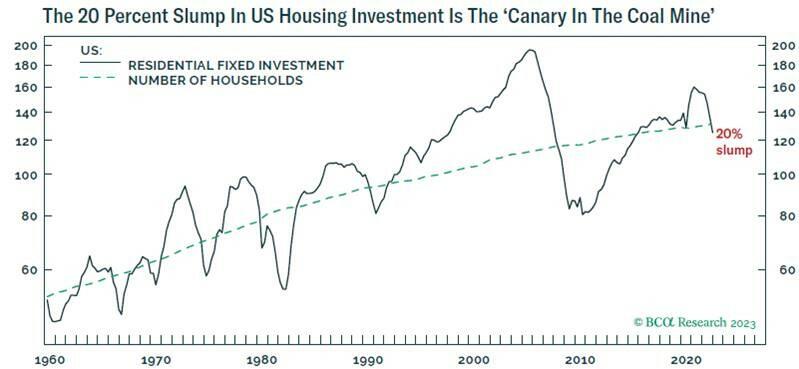
Quietly and off most people’s radar screens, US residential fixed investment (home building) has slumped by 20 percent in the past year – a rate of decline that puts it on a par with the major housing recessions of 1990, 1980, 1973, 1965, and 1951.
Housing recessions matter because they are the ‘canary in the coal mine’ for economy-wide recessions. Not all economic recessions follow housing recessions1, but most housing recessions presage economic recessions.
US Housing Recessions Are The ‘Canary In The Coal Mine’
Housing recessions are the canary in the coal mine for interest rate induced economic recessions. This is because, just as the canary is hyper-sensitive to toxic gases, housing investment is hyper-sensitive to interest rates.
Higher interest rates transfer more income from borrowers to lenders, making it more costly to service existing debt and take on new debt. This suffocates the most indebted parts of the economy – homeowners, homebuilders, and housing investment – before it suffocates the broader economy. So, just as the canary keels over before the coal miner, housing investment keels over before the broader economy.
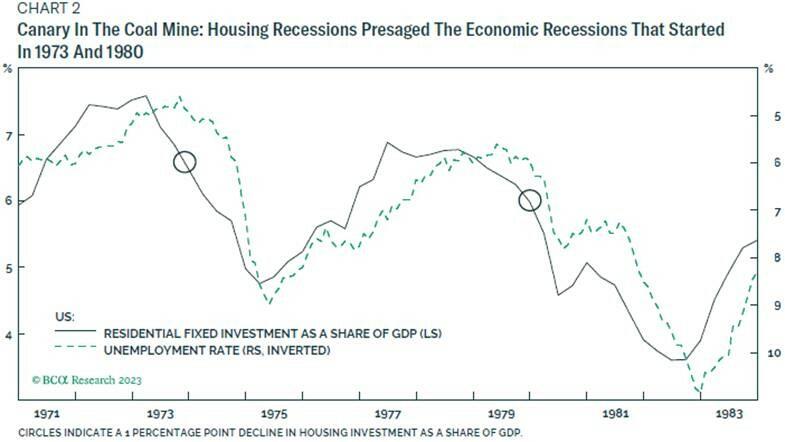
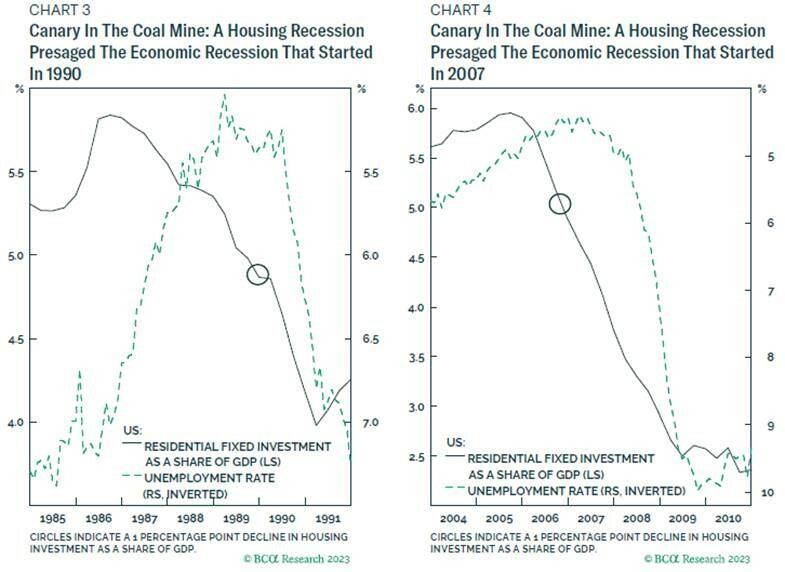
If we define a housing recession as a 1 percentage point decline in housing investment as a share of the economy, there have been nine US housing recessions since 1948 prior to the current episode. In seven cases, reaching the threshold of a housing recession was the canary in the coal mine for an NBER-defined US recession. The two exceptions being the housing recessions of 1951 and 1965.
Since 1970 though, the track record has been perfect. Reaching the threshold of a housing recession in: the fourth quarter of 1973; the first quarter of 1980; the first quarter of 1990; and the fourth quarter of 2006 were all canaries in the coal mine for NBER-defined US economic recessions that started in: November 1973; January 1980; July 1990; and December 2007.
In the current downcycle, it’s worth remembering that the first US rate hike happened barely 11 months ago. While this has been more than enough time to suffocate hyper rate-sensitive housing investment, it has not been enough time to suffocate the broader economy. But if the perfect post-1970 track record continues, the current US housing recession is the canary in the coal mine for an economic recession that starts at some point in 2023.
The US Housing Recession Isn’t Over Yet
Let’s now correct some common misunderstandings. Just as the canary itself does not kill the coal miner, it is not the housing recession itself that kills the economy. Both are just the early warning signs of a bigger danger. Therefore, the fact that housing investment makes up just 3 percent of the US economy is irrelevant.
In any case, a housing recession’s direct impact on the economy comes from the change in housing investment as a share of the economy. A decline from 4 to 2 percent of the economy, as seems likely now, creates the same drag on the economy as a decline from 8 to 6 percent, as happened during the 1950s and 60s.
Another common misunderstanding is that we are through most of the current US housing slump. Technically, this might be true, but it still leaves the likelihood of a further 10-15 percent contraction.
For the past 65 years, the structural trend in US real residential fixed investment has tracked the number of households.

This we can explain because the demand for new homes – new households – is a function of the number of existing households. Meanwhile, the main input costs for US home construction – the lumber price and construction sector wages – have moved broadly sideways in real terms.
Relative to housing investment’s structural trend, the size of the overshoot during a housing boom always establishes the size of a mirror-image undershoot in the subsequent housing recession. For example, in the housing ‘bubble’ of the early 2000s, housing investment overshot to almost double its structural trend. So, in the subsequent bust, it undershot to the mirror-image of almost half its structural trend.
In the current cycle, housing investment will likely slump from its recent 25 percent overshoot to a mirror-image undershoot. Given that it has already fallen to just below its structural trend, we can expect a further 10-15 percent contraction.
Some Investment Conclusions
Understandably, the housing investment cycle drives the performance of homebuilders, and especially their performance relative to less cyclical stocks such as consumer staples. Given a likely further 10-15 percent contraction in US housing investment, this suggests that the recent strong outperformance of US homebuilders is premature and vulnerable to setback.

This is confirmed by fragility in the 65-day fractal structure of homebuilder outperformance, which indicates that extreme trend-chasing has driven the recent rally, also making it vulnerable to a setback (see Chart 9).
On this basis, a new recommended tactical trade is to underweight US homebuilders versus the market, setting a profit target and symmetrical stop-loss at 12 percent.
In terms of the broader investment conclusion, I repeat what I wrote two weeks ago. The four deadliest words in life are ‘it’s different this time’. So far, there is nothing to suggest that it is different this time. Indeed, the severe housing recession in the US confirms that higher interest rates are having their expected effect.
To reiterate, the first US rate hike happened barely 11 months ago. While this has been more than enough time to suffocate hyper rate-sensitive housing investment, it will take several more months to suffocate the broader economy.
Of course, it could be different this time and we must remain open to that possibility. But until the data proves otherwise, we must assume that it’s not. The canary in the coal mine is warning of a recession, and we should position accordingly.
Hence, on a 6-12 month horizon, stay:
- Overweight bonds versus stocks.
- Overweight healthcare versus technology and basic resources.
- Overweight developed markets (DM) versus emerging markets (EM).
[1] For example, the dot com recession of 2001 and pandemic recession of 2020 did not follow housing recessions.
More From The Real Estate Guys…
- Sign up for The Real Estate Guys™ New Content Notifcations
- Check out all the great free info in our Special Reports library.
- Don’t miss an episode of The Real Estate Guys™ radio show. Subscribe on iTunes or Android or YouTube!
- Stay connected with The Real Estate Guys™ on Facebook, and our Feedback page.
The Real Estate Guys™ radio show and podcast provides real estate investing news, education, training, and resources to help real estate investors succeed.
Subscribe
Broadcasting since 1997 with over 600 episodes on iTunes!
![]()
![]()
![]()
Love the show? Tell the world! When you promote the show, you help us attract more great guests for your listening pleasure!


