
Foreclosure Starts See an Annual Increase of 29 Percent; Bank Repossessions at Highest Level in Three Years
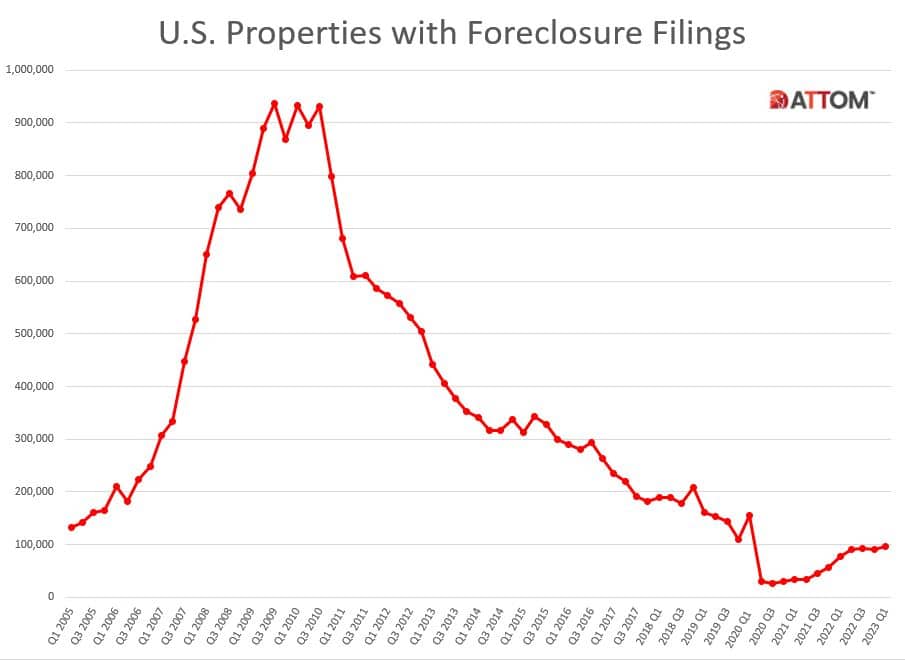
IRVINE, Calif. — April 19, 2023 — ATTOM, a leading curator of land, property, and real estate data, today released its Q1 2023 U.S. Foreclosure Market Report, which shows a total of 95,712 U.S. properties with a foreclosure filings during the first quarter of 2023, up 6 percent from the previous quarter and up 22 percent from a year ago.
The report also shows a total of 36,617 U.S. properties with foreclosure filings in March 2023, up 20 percent from the previous month and up 10 percent from a year ago — the 23rd consecutive month with a year-over-year increase in U.S. foreclosure activity.
“Despite efforts made by government agencies and policy makers to try and reduce foreclosure rates, we are seeing an upward trend in foreclosure activity,” said Rob Barber, chief executive officer at ATTOM. “This unfortunate trend can be attributed to a variety of factors, such as rising unemployment rates, foreclosure filings making their way through the pipeline after two years of government intervention, and other ongoing economic challenges. However, with many homeowners still having significant home equity, that may help in keeping increased levels of foreclosure activity at bay.”
Foreclosure starts increase nationwide
A total of 65,346 U.S. properties started the foreclosure process in Q1 2023, up 3 percent from the previous quarter and up 29 percent from a year ago.
States that had the greatest number of foreclosures starts in Q1 2023 included, California (6,867 foreclosure starts); Texas (6,764 foreclosure starts); Florida (5,724 foreclosure starts); New York (4,345 foreclosure starts); and Illinois (4,006 foreclosure starts).

Those major metros with a population of 200,000 or more that had the greatest number of foreclosures starts in Q1 2023 included, New York, New York (4,674 foreclosure starts); Chicago, Illinois (3,549 foreclosure starts); Los Angeles, California (2,210 foreclosure starts); Houston, Texas (2,120 foreclosure starts); and Philadelphia, Pennsylvania (1,985 foreclosure starts).
Highest foreclosure rates in Illinois, Delaware, and New Jersey
Nationwide one in every 1,459 housing units had a foreclosure filing in Q1 2023. States with the highest foreclosure rates were Illinois (one in every 762 housing units with a foreclosure filing); Delaware (one in every 812 housing units); New Jersey (one in every 824 housing units); Maryland (one in every 897 housing units); and Nevada (one in every 947 housing units).
Among 223 metropolitan statistical areas with a population of at least 200,000, those with the highest foreclosure rates in Q1 2023 were Fayetteville, North Carolina (one in every 526 housing units); Cleveland, Ohio (one in 582); Atlantic City, New Jersey (one in 661); Columbia, South Carolina (one in 671); and Bakersfield, California (one in 688).

Other major metros with a population of at least 1 million and foreclosure rates in the top 15 highest nationwide, included Cleveland, Ohio at No.2; Chicago, Illinois at No. 6; Las Vegas, Nevada at No. 10; Philadelphia, Pennsylvania at No. 12; and Riverside, California at No. 14.
Bank repossessions increase 8 percent from last quarter
Lenders repossessed 12,518 U.S. properties through foreclosure (REO) in Q1 2023, up 8 percent from the previous quarter and up 6 percent from a year ago.

Those states that had the greatest number of REOs in Q1 2023 were Michigan (1,819 REOs); Illinois (1,039 REOs); California (846 REOs); Pennsylvania (788 REOs); and New York (774 REOs).
Average time to foreclose increases 12 percent from previous quarter
Properties foreclosed in Q1 2023 had been in the foreclosure process an average of 950 days, the highest number of average days to foreclose since Q1 2018. This is up 12 percent from the previous quarter and up 4 percent from Q1 2022.

States with the longest average foreclosure timelines for homes foreclosed in Q1 2023 were Louisiana (2,770 days); Hawaii (2,486 days); New York (1,963 days); Kentucky (1,881 days); and New Jersey (1,697 days).
States with the shortest average foreclosure timelines for homes foreclosed in Q1 2023 were Wyoming (111 days); Minnesota (141 days); Montana (143 days); Texas (146 days); and Arkansas (157 days).
March 2023 Foreclosure Activity High-Level Takeaways
- Nationwide in March 2023, one in every 3,813 properties had a foreclosure filing.
- States with the highest foreclosure rates in March 2022 were Illinois (one in every 2,050 housing units with a foreclosure filing); Delaware (one in every 2,161 housing units); Nevada (one in every 2,178 housing units); Indiana (one in every 2,223 housing units); and New Jersey (one in every 2,299 housing units).
- 24,234 U.S. properties started the foreclosure process in March 2023, up 19 percent from the previous month and up 8 percent from March 2022.
- Lenders completed the foreclosure process on 4,791 U.S. properties in March 2023, up 25 percent from the previous month and up 9 percent from March 2022.
U.S. Foreclosure Market Data by State – Q1 2023
| Rate Rank | State Name | Total Properties with Filings | 1/every X HU (Foreclosure Rate) | %∆ Q4 2022 | %∆ Q1 2022 |
| U.S. | 95,712 | 1,459 | 5.51 | 22.28 | |
| 32 | Alabama | 1,025 | 2,223 | -17.87 | -10.32 |
| 27 | Alaska | 152 | 2,078 | 20.63 | 192.31 |
| 21 | Arizona | 1,717 | 1,780 | 19.40 | 3.68 |
| 22 | Arkansas | 717 | 1,899 | -9.13 | 62.59 |
| 14 | California | 10,208 | 1,404 | -3.74 | 23.84 |
| 29 | Colorado | 1,146 | 2,142 | 9.25 | 38.07 |
| 13 | Connecticut | 1,097 | 1,392 | 14.99 | 33.13 |
| 2 | Delaware | 548 | 812 | 3.59 | 41.97 |
| District of Columbia | 179 | 1,923 | 22.60 | 280.85 | |
| 10 | Florida | 8,233 | 1,186 | 16.83 | 1.06 |
| 12 | Georgia | 3,222 | 1,358 | 9.97 | 24.31 |
| 31 | Hawaii | 252 | 2,210 | -6.32 | 29.90 |
| 42 | Idaho | 212 | 3,501 | 15.85 | 69.60 |
| 1 | Illinois | 7,100 | 762 | -5.26 | 3.48 |
| 7 | Indiana | 2,949 | 987 | 15.33 | 22.11 |
| 16 | Iowa | 966 | 1,457 | -3.59 | 32.69 |
| 44 | Kansas | 313 | 4,065 | 17.23 | 15.93 |
| 46 | Kentucky | 453 | 4,389 | 1.12 | 8.63 |
| 24 | Louisiana | 1,052 | 1,964 | 10.39 | 15.99 |
| 41 | Maine | 227 | 3,250 | -36.94 | -39.14 |
| 4 | Maryland | 2,806 | 897 | 29.61 | 89.21 |
| 34 | Massachusetts | 1,314 | 2,268 | -15.72 | 36.02 |
| 8 | Michigan | 4,436 | 1,029 | 41.23 | 38.41 |
| 30 | Minnesota | 1,139 | 2,169 | 7.15 | 47.35 |
| 33 | Mississippi | 584 | 2,256 | 15.64 | 34.87 |
| 37 | Missouri | 1,063 | 2,617 | 14.18 | -7.65 |
| 47 | Montana | 97 | 5,284 | -23.02 | 25.97 |
| 35 | Nebraska | 336 | 2,502 | -8.45 | 25.84 |
| 5 | Nevada | 1,341 | 947 | 14.13 | 14.13 |
| 36 | New Hampshire | 246 | 2,587 | 25.51 | 27.46 |
| 3 | New Jersey | 4,539 | 824 | 3.77 | -4.48 |
| 18 | New Mexico | 595 | 1,575 | 24.74 | 58.24 |
| 11 | New York | 6,349 | 1,331 | 1.03 | 97.48 |
| 17 | North Carolina | 3,064 | 1,525 | -6.78 | 35.28 |
| 49 | North Dakota | 47 | 7,875 | -42.68 | 34.29 |
| 6 | Ohio | 5,313 | 985 | 4.88 | 0.45 |
| 15 | Oklahoma | 1,213 | 1,436 | 25.44 | 26.88 |
| 38 | Oregon | 654 | 2,751 | -1.21 | 173.64 |
| 20 | Pennsylvania | 3,269 | 1,752 | -1.80 | 20.98 |
| 40 | Rhode Island | 174 | 2,765 | -2.79 | 23.40 |
| 9 | South Carolina | 2,234 | 1,041 | -9.48 | 2.95 |
| 50 | South Dakota | 25 | 15,535 | 19.05 | 13.64 |
| 28 | Tennessee | 1,436 | 2,097 | 21.28 | 32.47 |
| 19 | Texas | 7,221 | 1,583 | 13.59 | 44.94 |
| 25 | Utah | 576 | 1,968 | 6.67 | 3.23 |
| 48 | Vermont | 43 | 7,756 | 13.16 | 79.17 |
| 26 | Virginia | 1,740 | 2,067 | 0.58 | 35.20 |
| 45 | Washington | 751 | 4,222 | -4.57 | 16.43 |
| 43 | West Virginia | 212 | 4,054 | 4.95 | 168.35 |
| 39 | Wisconsin | 984 | 2,763 | 8.25 | 0.10 |
| 23 | Wyoming | 143 | 1,901 | -4.67 | 53.76 |
Report methodology
The ATTOM U.S. Foreclosure Market Report provides a count of the total number of properties with at least one foreclosure filing entered into the ATTOM Data Warehouse during the month and quarter. Some foreclosure filings entered into the database during the quarter may have been recorded in the previous quarter. Data is collected from more than 3,000 counties nationwide, and those counties account for more than 99 percent of the U.S. population. ATTOM’s report incorporates documents filed in all three phases of foreclosure: Default — Notice of Default (NOD) and Lis Pendens (LIS); Auction — Notice of Trustee Sale and Notice of Foreclosure Sale (NTS and NFS); and Real Estate Owned, or REO properties (that have been foreclosed on and repurchased by a bank). For the annual, midyear and quarterly reports, if more than one type of foreclosure document is received for a property during the timeframe, only the most recent filing is counted in the report. The annual, midyear, quarterly and monthly reports all check if the same type of document was filed against a property previously. If so, and if that previous filing occurred within the estimated foreclosure timeframe for the state where the property is located, the report does not count the property in the current year, quarter or month.
About ATTOM
ATTOM provides premium property data to power products that improve transparency, innovation, efficiency and disruption in a data-driven economy. ATTOM multi-sources property tax, deed, mortgage, foreclosure, environmental risk, natural hazard, and neighborhood data for more than 155 million U.S. residential and commercial properties covering 99 percent of the nation’s population. A rigorous data management process involving more than 20 steps validates, standardizes, and enhances the real estate data collected by ATTOM, assigning each property record with a persistent, unique ID — the ATTOM ID. The 30TB ATTOM Data Warehouse fuels innovation in many industries including mortgage, real estate, insurance, marketing, government and more through flexible data delivery solutions that include bulk file licenses, property data APIs, real estate market trends, property navigator and more. Also, introducing our newest innovative solution, that offers immediate access and streamlines data management – ATTOM Cloud.
More From The Real Estate Guys…
- Sign up for The Real Estate Guys™ New Content Notifcations
- Check out all the great free info in our Special Reports library.
- Don’t miss an episode of The Real Estate Guys™ radio show. Subscribe on iTunes or Android or YouTube!
- Stay connected with The Real Estate Guys™ on Facebook, and our Feedback page.
The Real Estate Guys™ radio show and podcast provides real estate investing news, education, training, and resources to help real estate investors succeed.
Subscribe
Broadcasting since 1997 with over 600 episodes on iTunes!
![]()
![]()
![]()
Love the show? Tell the world! When you promote the show, you help us attract more great guests for your listening pleasure!


