
Signs of trouble continue to show up in the world’s largest, most liquid government-securities market as government bonds logged their worst week in years and the U.S. central bank’s interest rate hiking cycle gets under way.
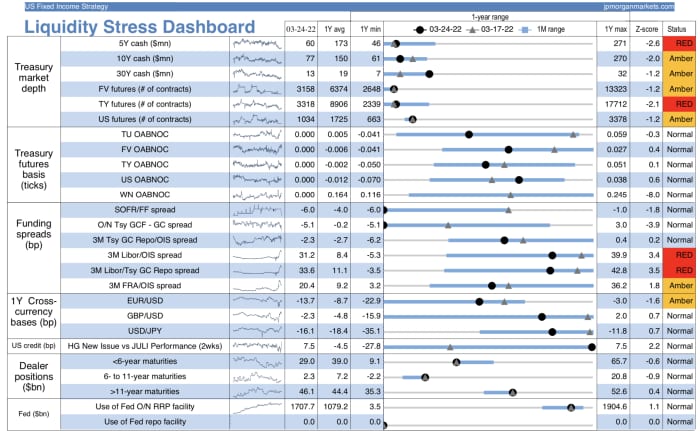
All six of the gauges used to monitor U.S. Treasury market depth — or the ease with which securities can be bought and sold without significantly impacting their prices — have remained at abnormal conditions for the month of March, according to JPMorgan Chase & Co.’s JPM, -0.45% Liquidity Stress Dashboard. This was the case before Friday’s broad, aggressive selloff in Treasurys — which sent 2- TMUBMUSD02Y, 2.294% and 10-year yields TMUBMUSD10Y, 2.337% to their biggest weekly gains since June 2009 and September 2019, respectively. Yields and prices move in opposite directions — so soaring yields reflect a drop in demand and prices on Treasurys.
The decline in Treasury market depth has corresponded with the recent substantial rise in yields as investors factor in the Fed’s first quarter percentage point rate increase since 2018 and the likelihood of possibly bigger moves to come. The biggest driver behind the market’s illiquidity is the narrative of a U.S. central bank “pushing rates higher,” according to JPMorgan rates strategist Alex Roever.
“We’ve had conditions for several months where cash market depths have been low, and part of that is because of rates backing up and being very sensitive to the Fed and inflation news,” Roever said via phone Friday. “That means it can be very painful to hold bonds and, in aggregate, it feels like we’re not seeing as many end users buy Treasurys bonds as we have before, with demand lower.”
JPMorgan’s dashboard captures more than two dozen different gauges of market conditions, most of them in the Treasurys market. In total, 10 of the gauges being monitored were flashing either a “RED” or “Amber” status as of Thursday, before Friday’s market action.
On Friday, two- TMUBMUSD02Y, 2.294% and 10-year Treasury yields TMUBMUSD10Y, 2.337% climbed to their highest levels since May 6, 2019, while the spread between 5- TMUBMUSD05Y, 2.419% and 30-year yields TMUBMUSD30Y, 2.466% teetered on the brink of inversion.
More From The Real Estate Guys…
- Check out all the great free info in our Special Reports library.
- Don’t miss an episode of The Real Estate Guys™ radio show. Subscribe on iTunes or Android or YouTube!
- Stay connected with The Real Estate Guys™ on Facebook, and our Feedback page.
The Real Estate Guys™ radio show and podcast provides real estate investing news, education, training, and resources to help real estate investors succeed.
Subscribe
Broadcasting since 1997 with over 600 episodes on iTunes!
![]()
![]()
![]()
Love the show? Tell the world! When you promote the show, you help us attract more great guests for your listening pleasure!


